
DataSlicer by datafeta
Explorative Data Analysis For Engineers - No Fancy BI-Dashboards
Open-source OLAP-style data analysis in your browser.
Connect to ClickHouse, Kaggle, or CSV/JSON/Parquet files and explore your data interactively.
Explorative Data Analysis For Engineers - No Fancy BI-Dashboards
Open-source OLAP-style data analysis in your browser.
Connect to ClickHouse, Kaggle, or CSV/JSON/Parquet files and explore your data interactively.
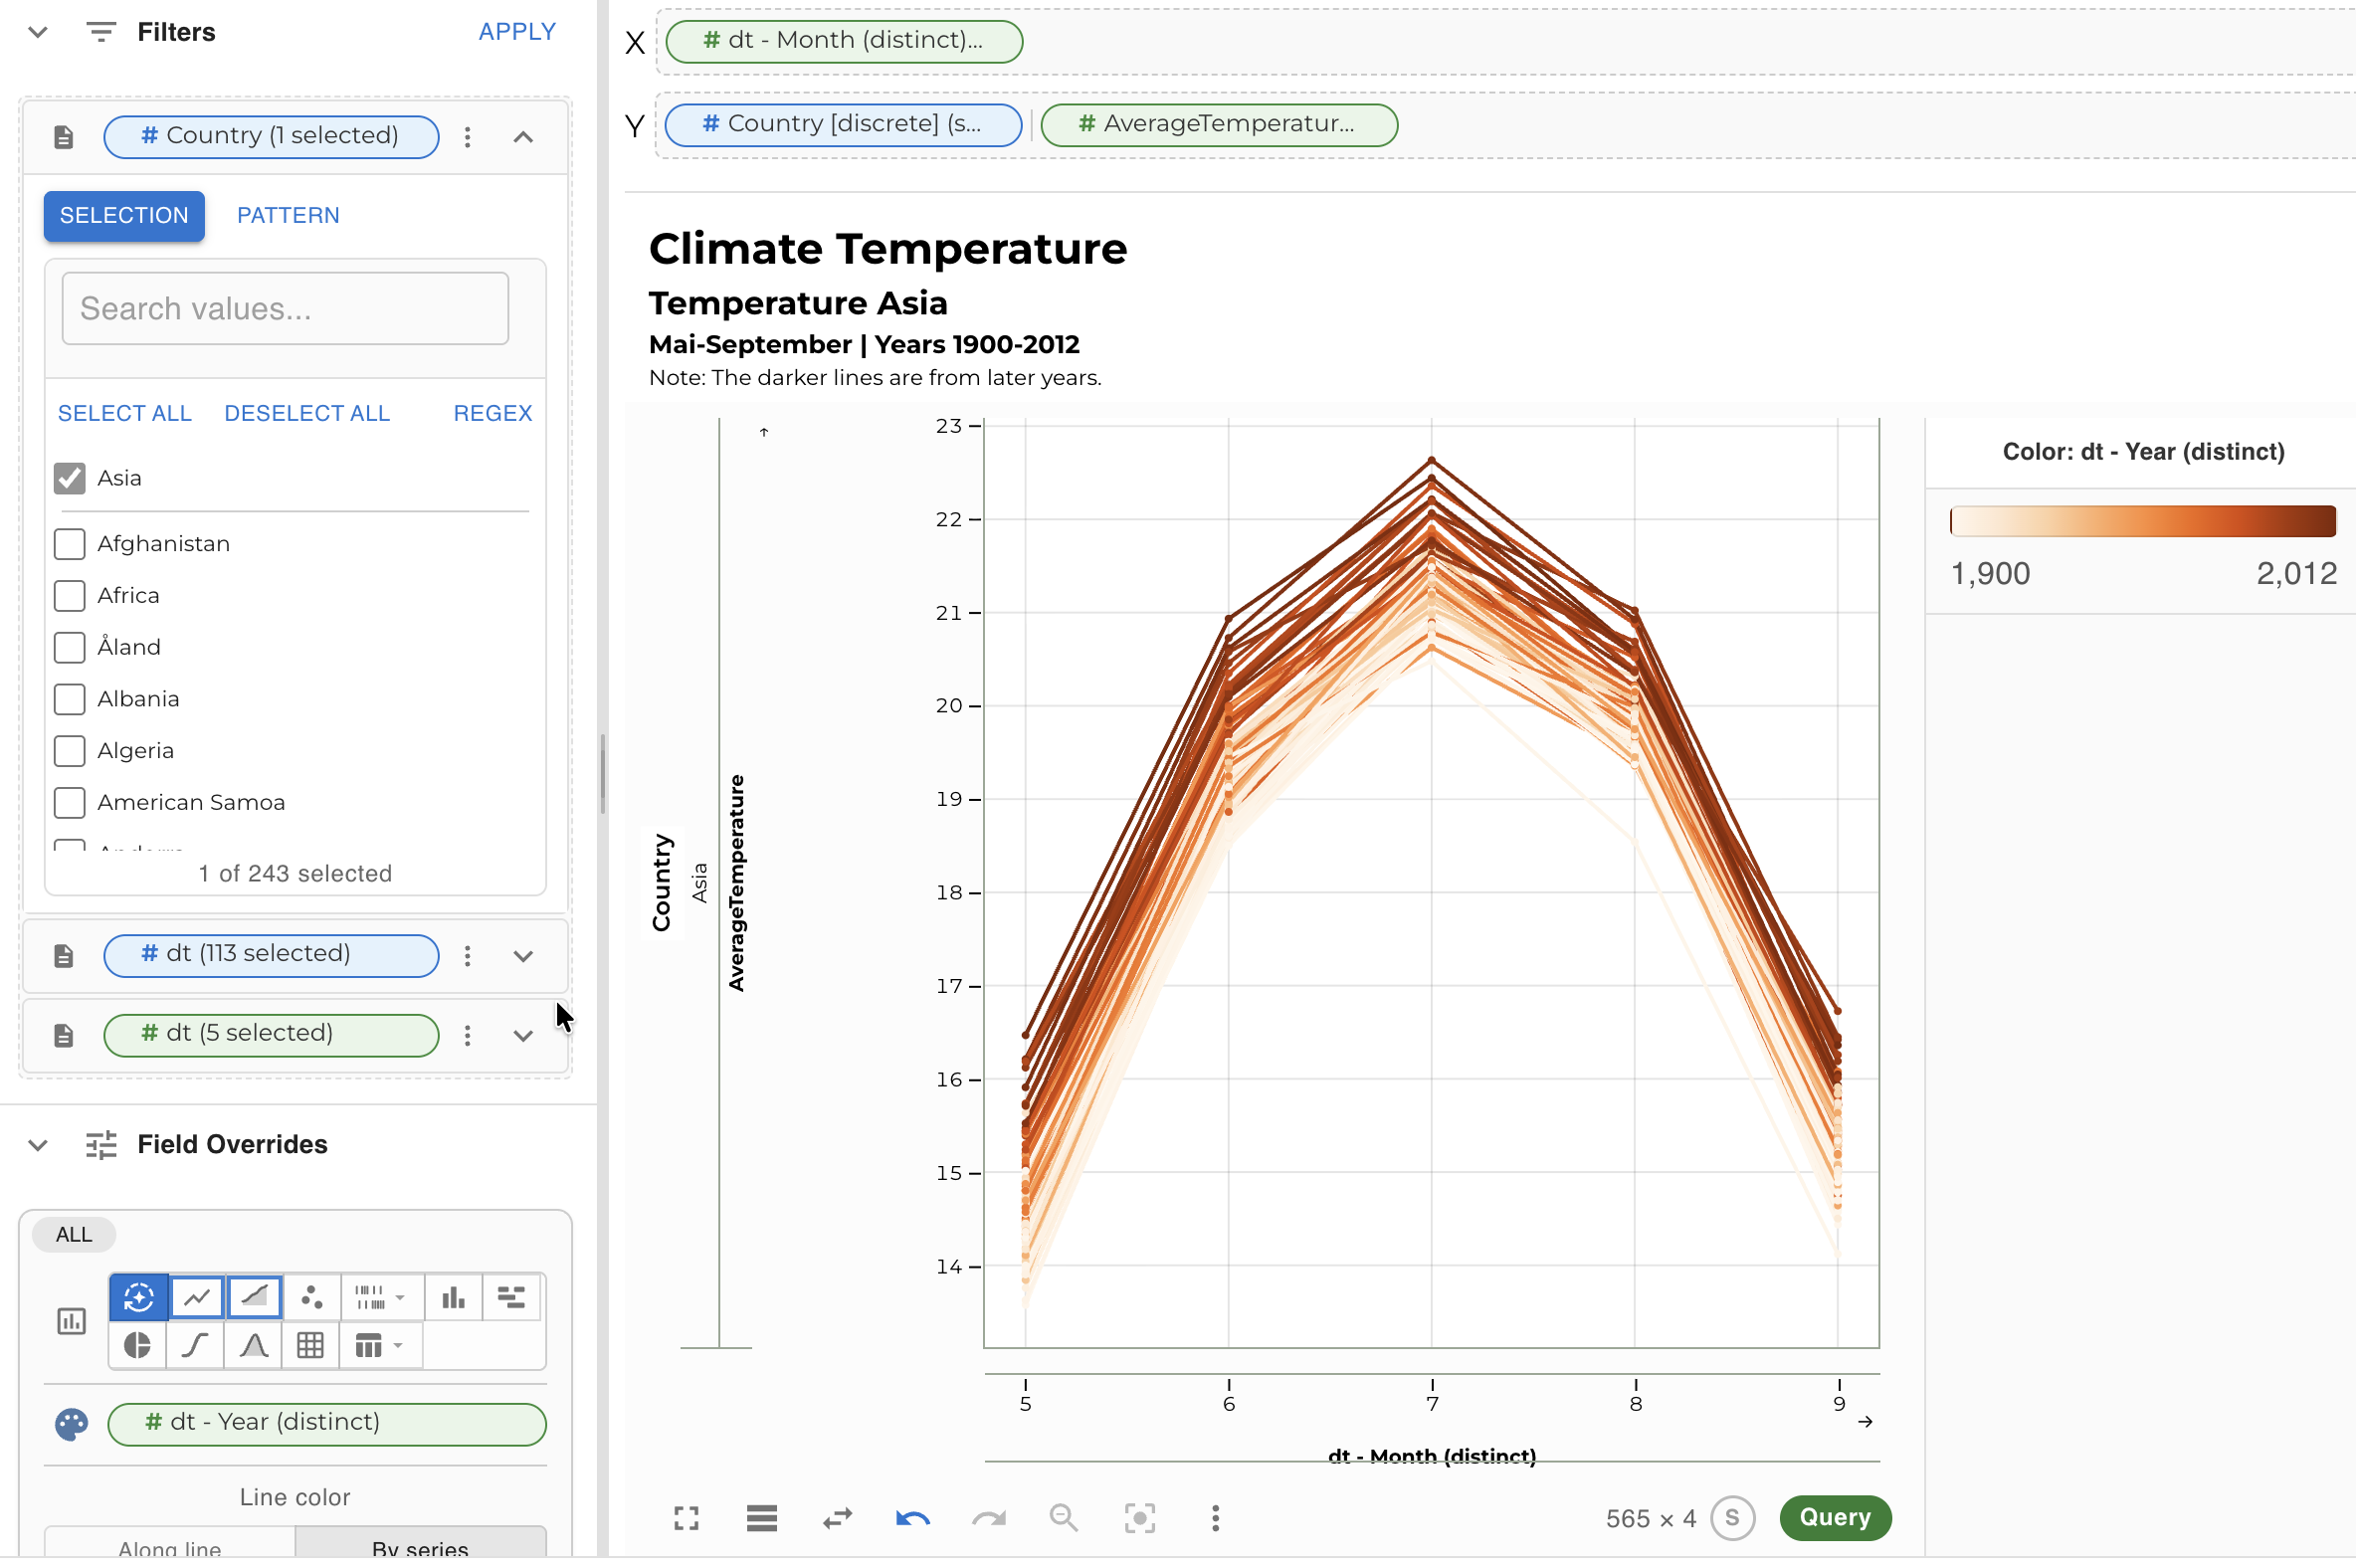
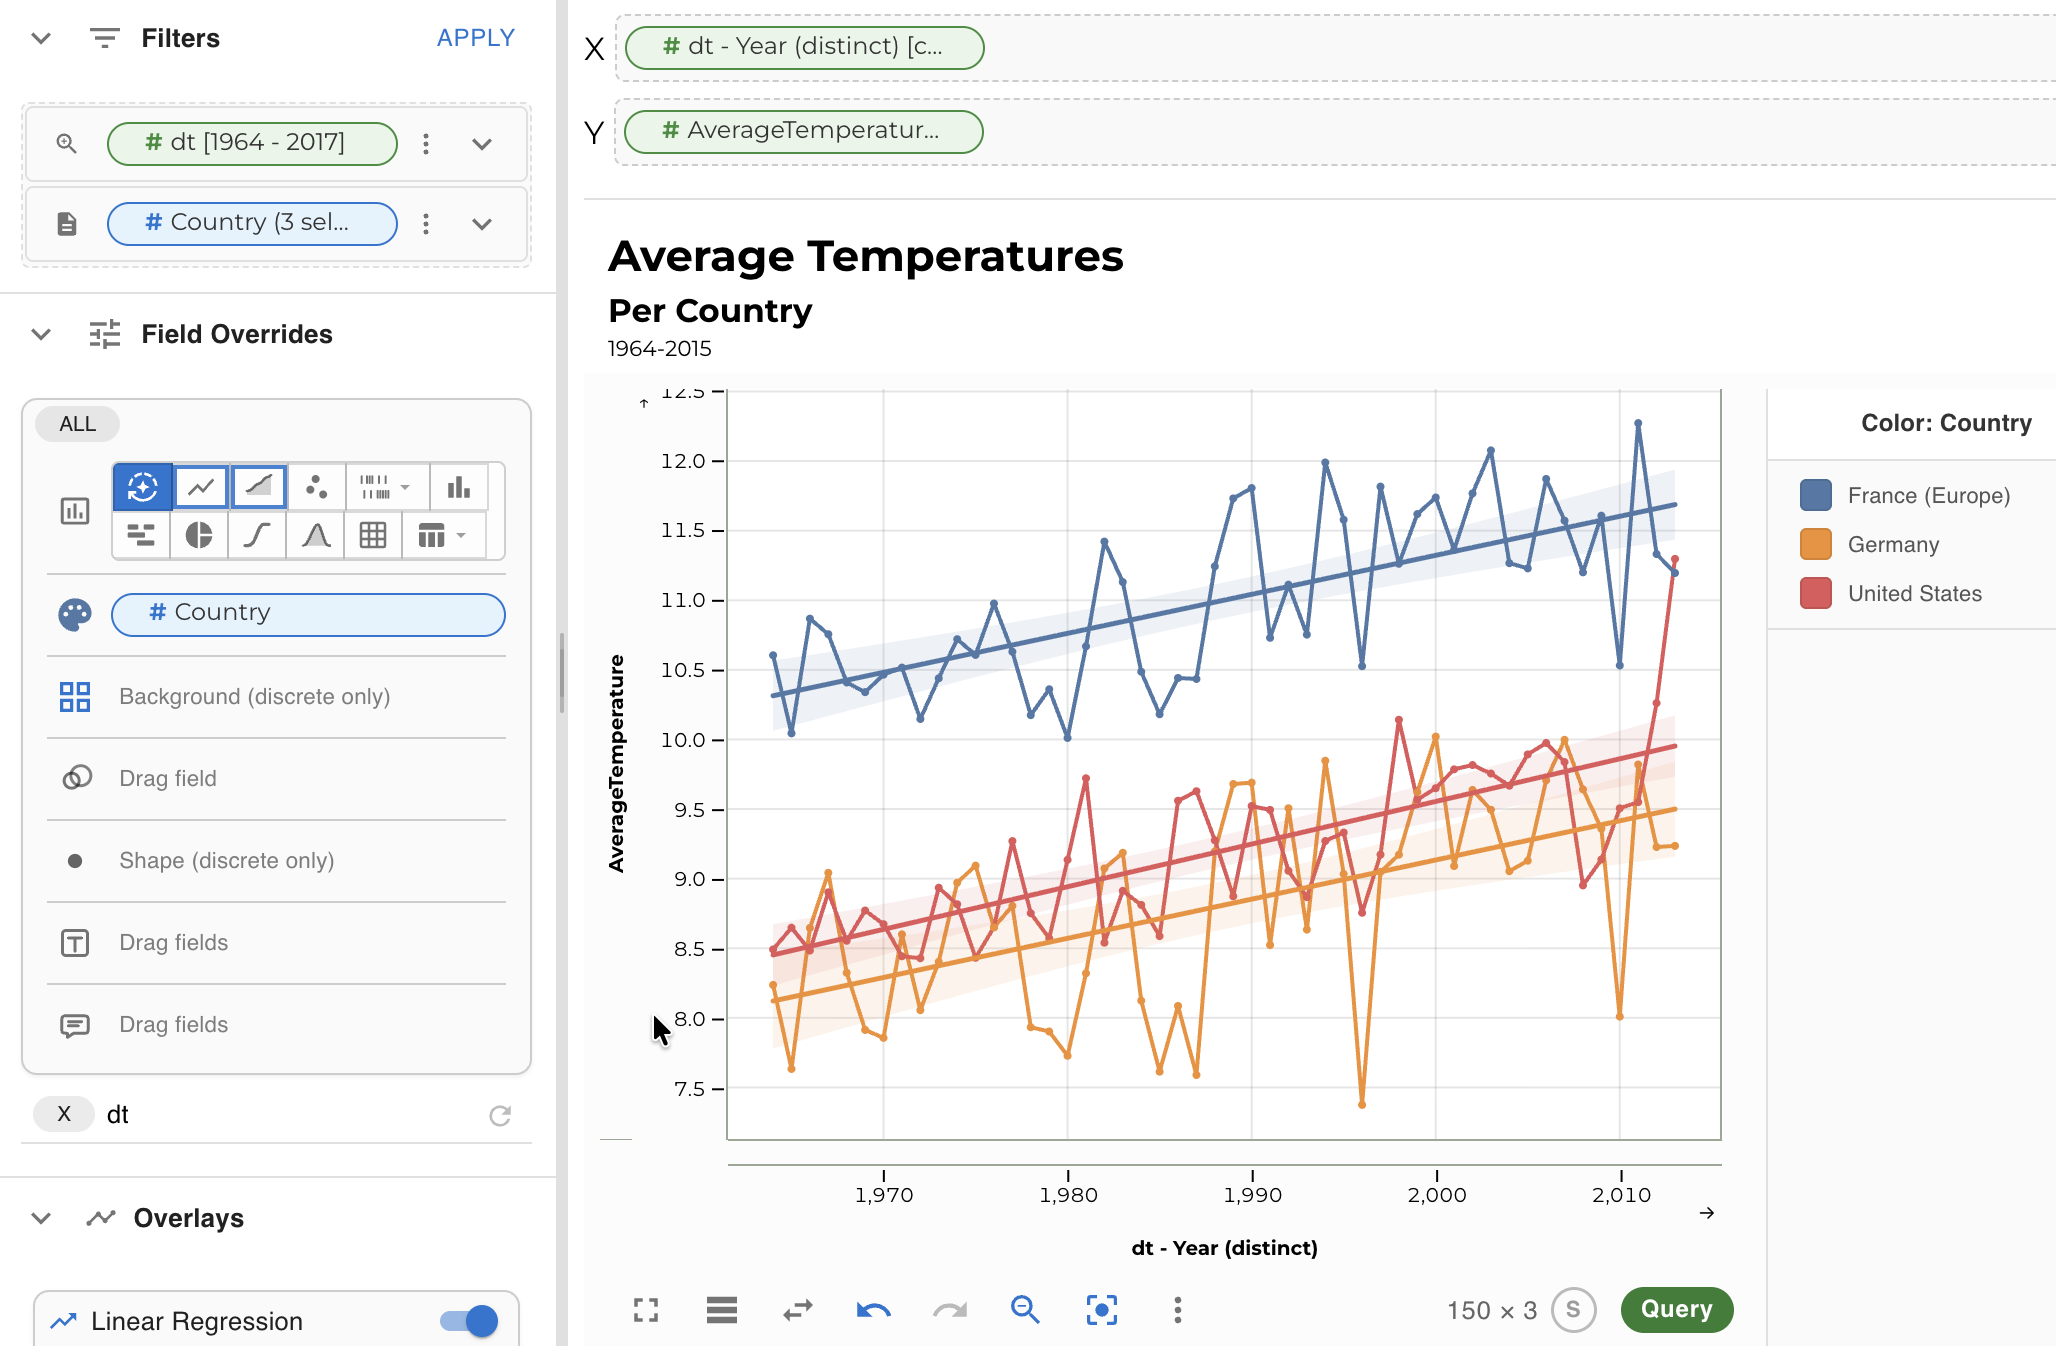
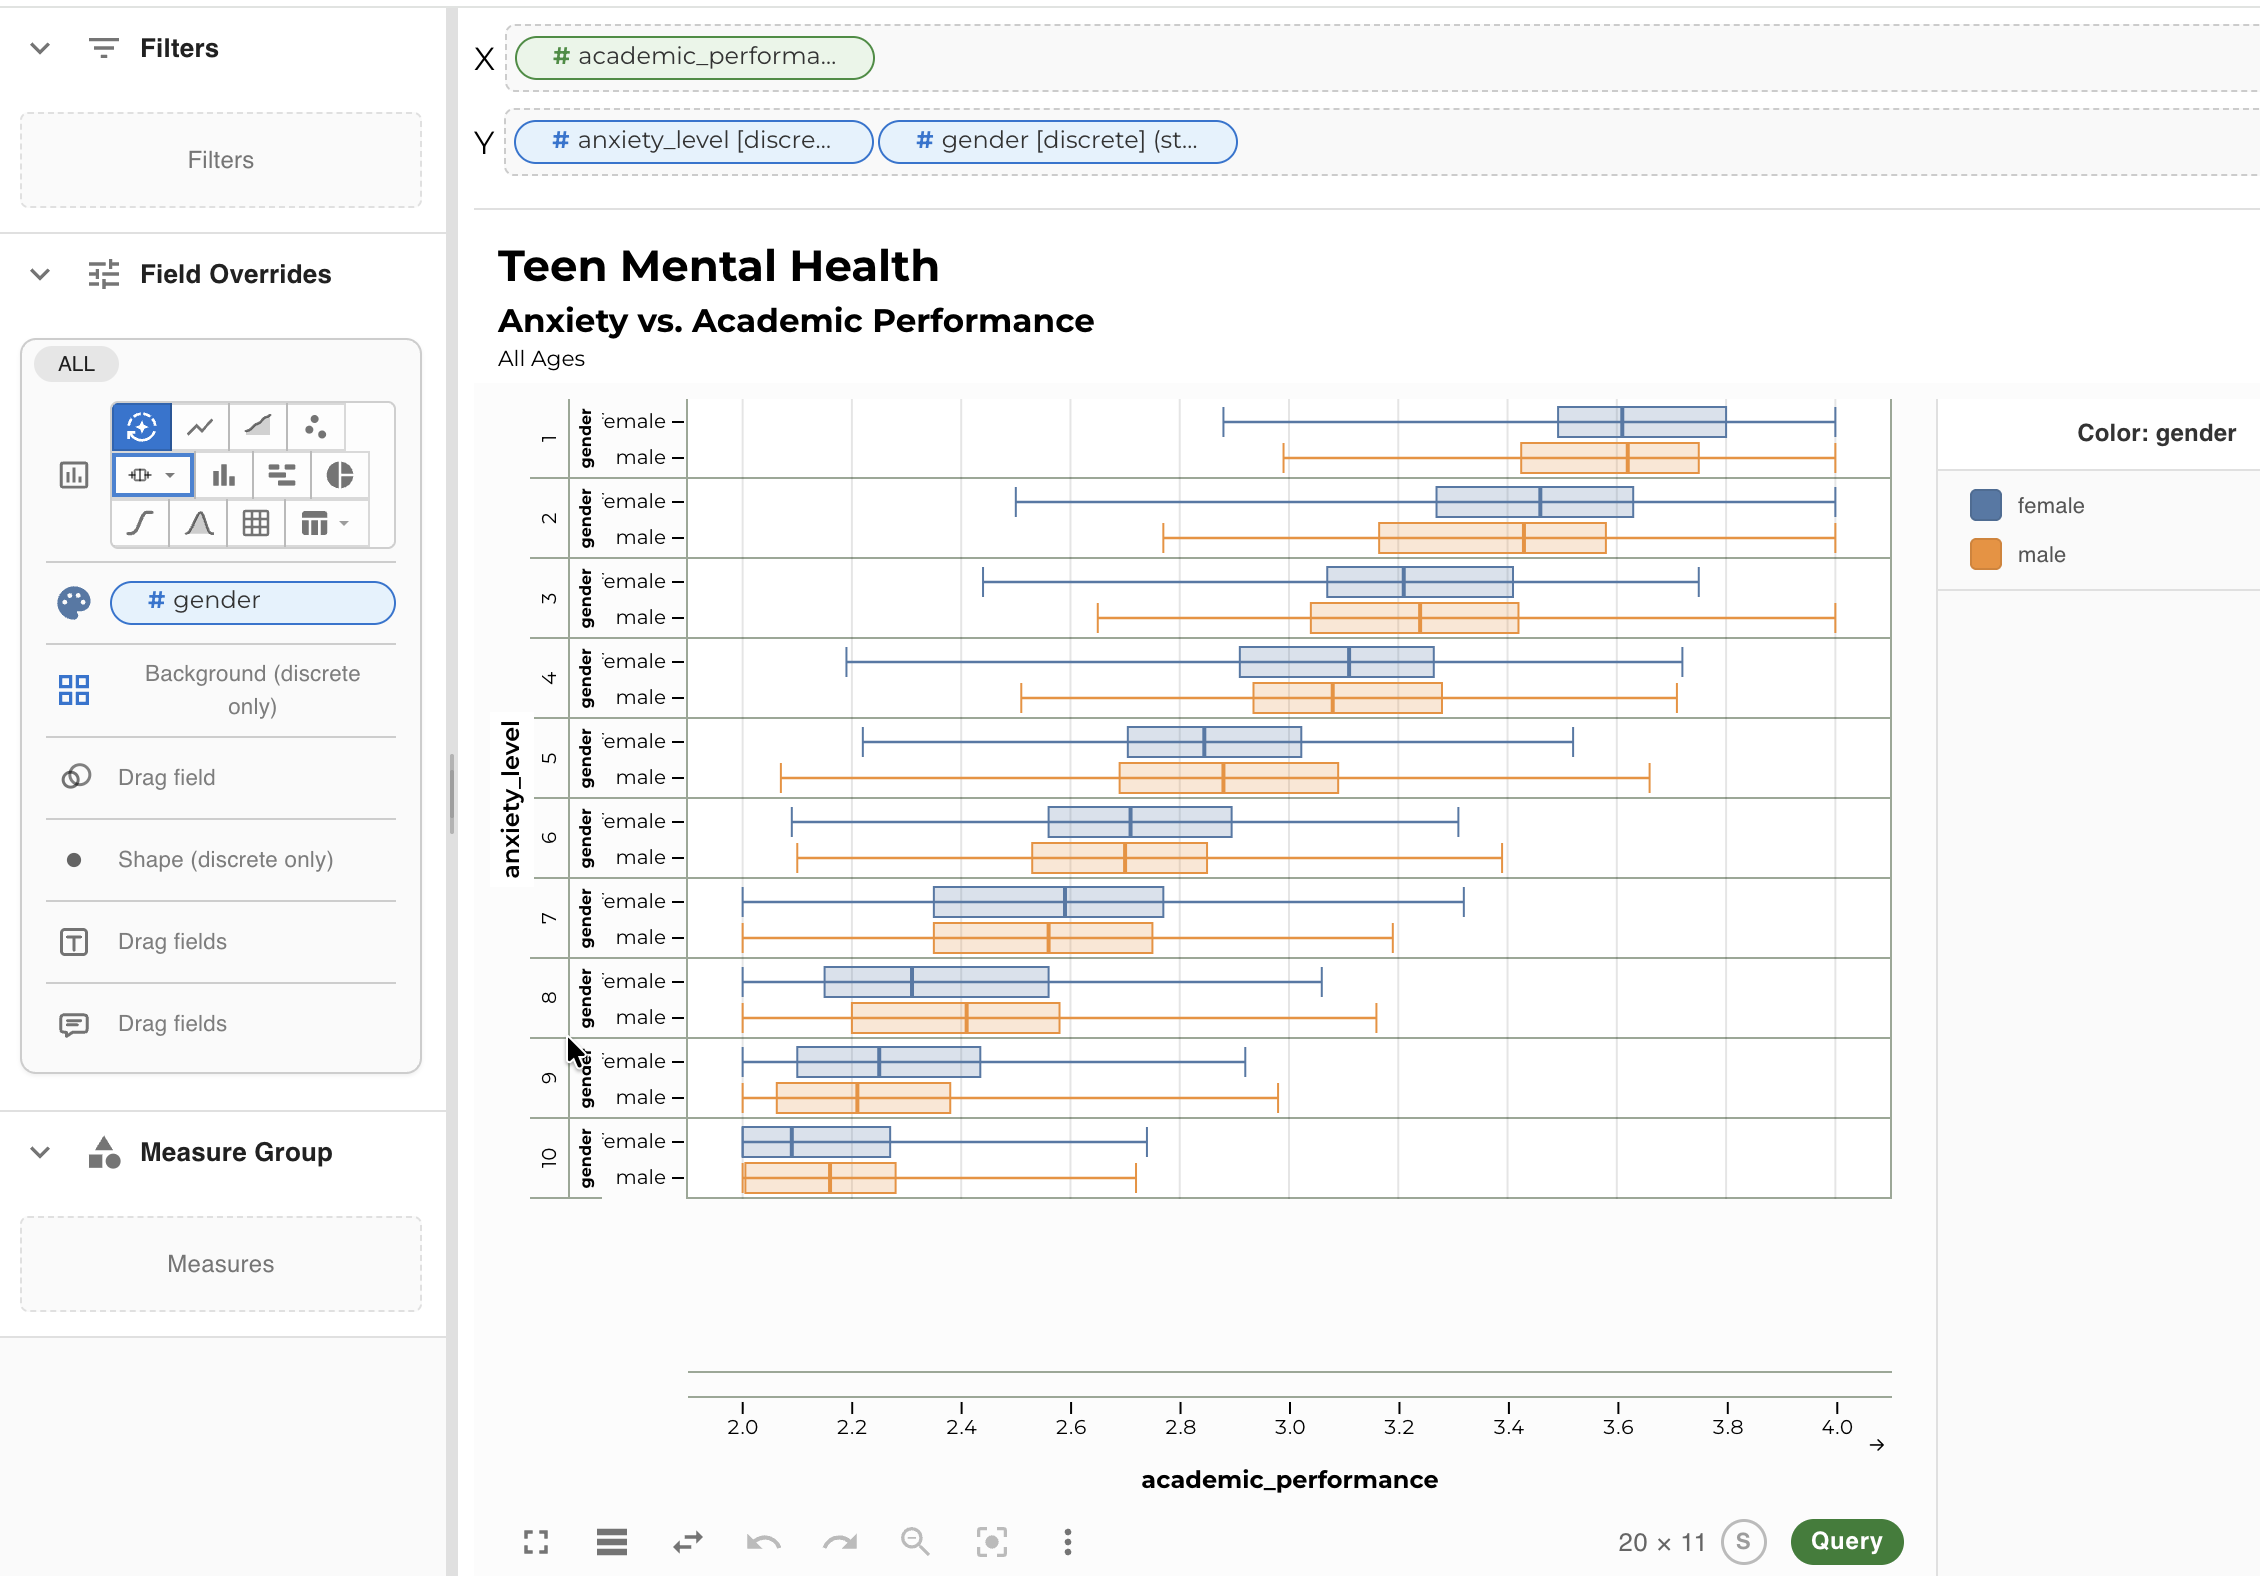
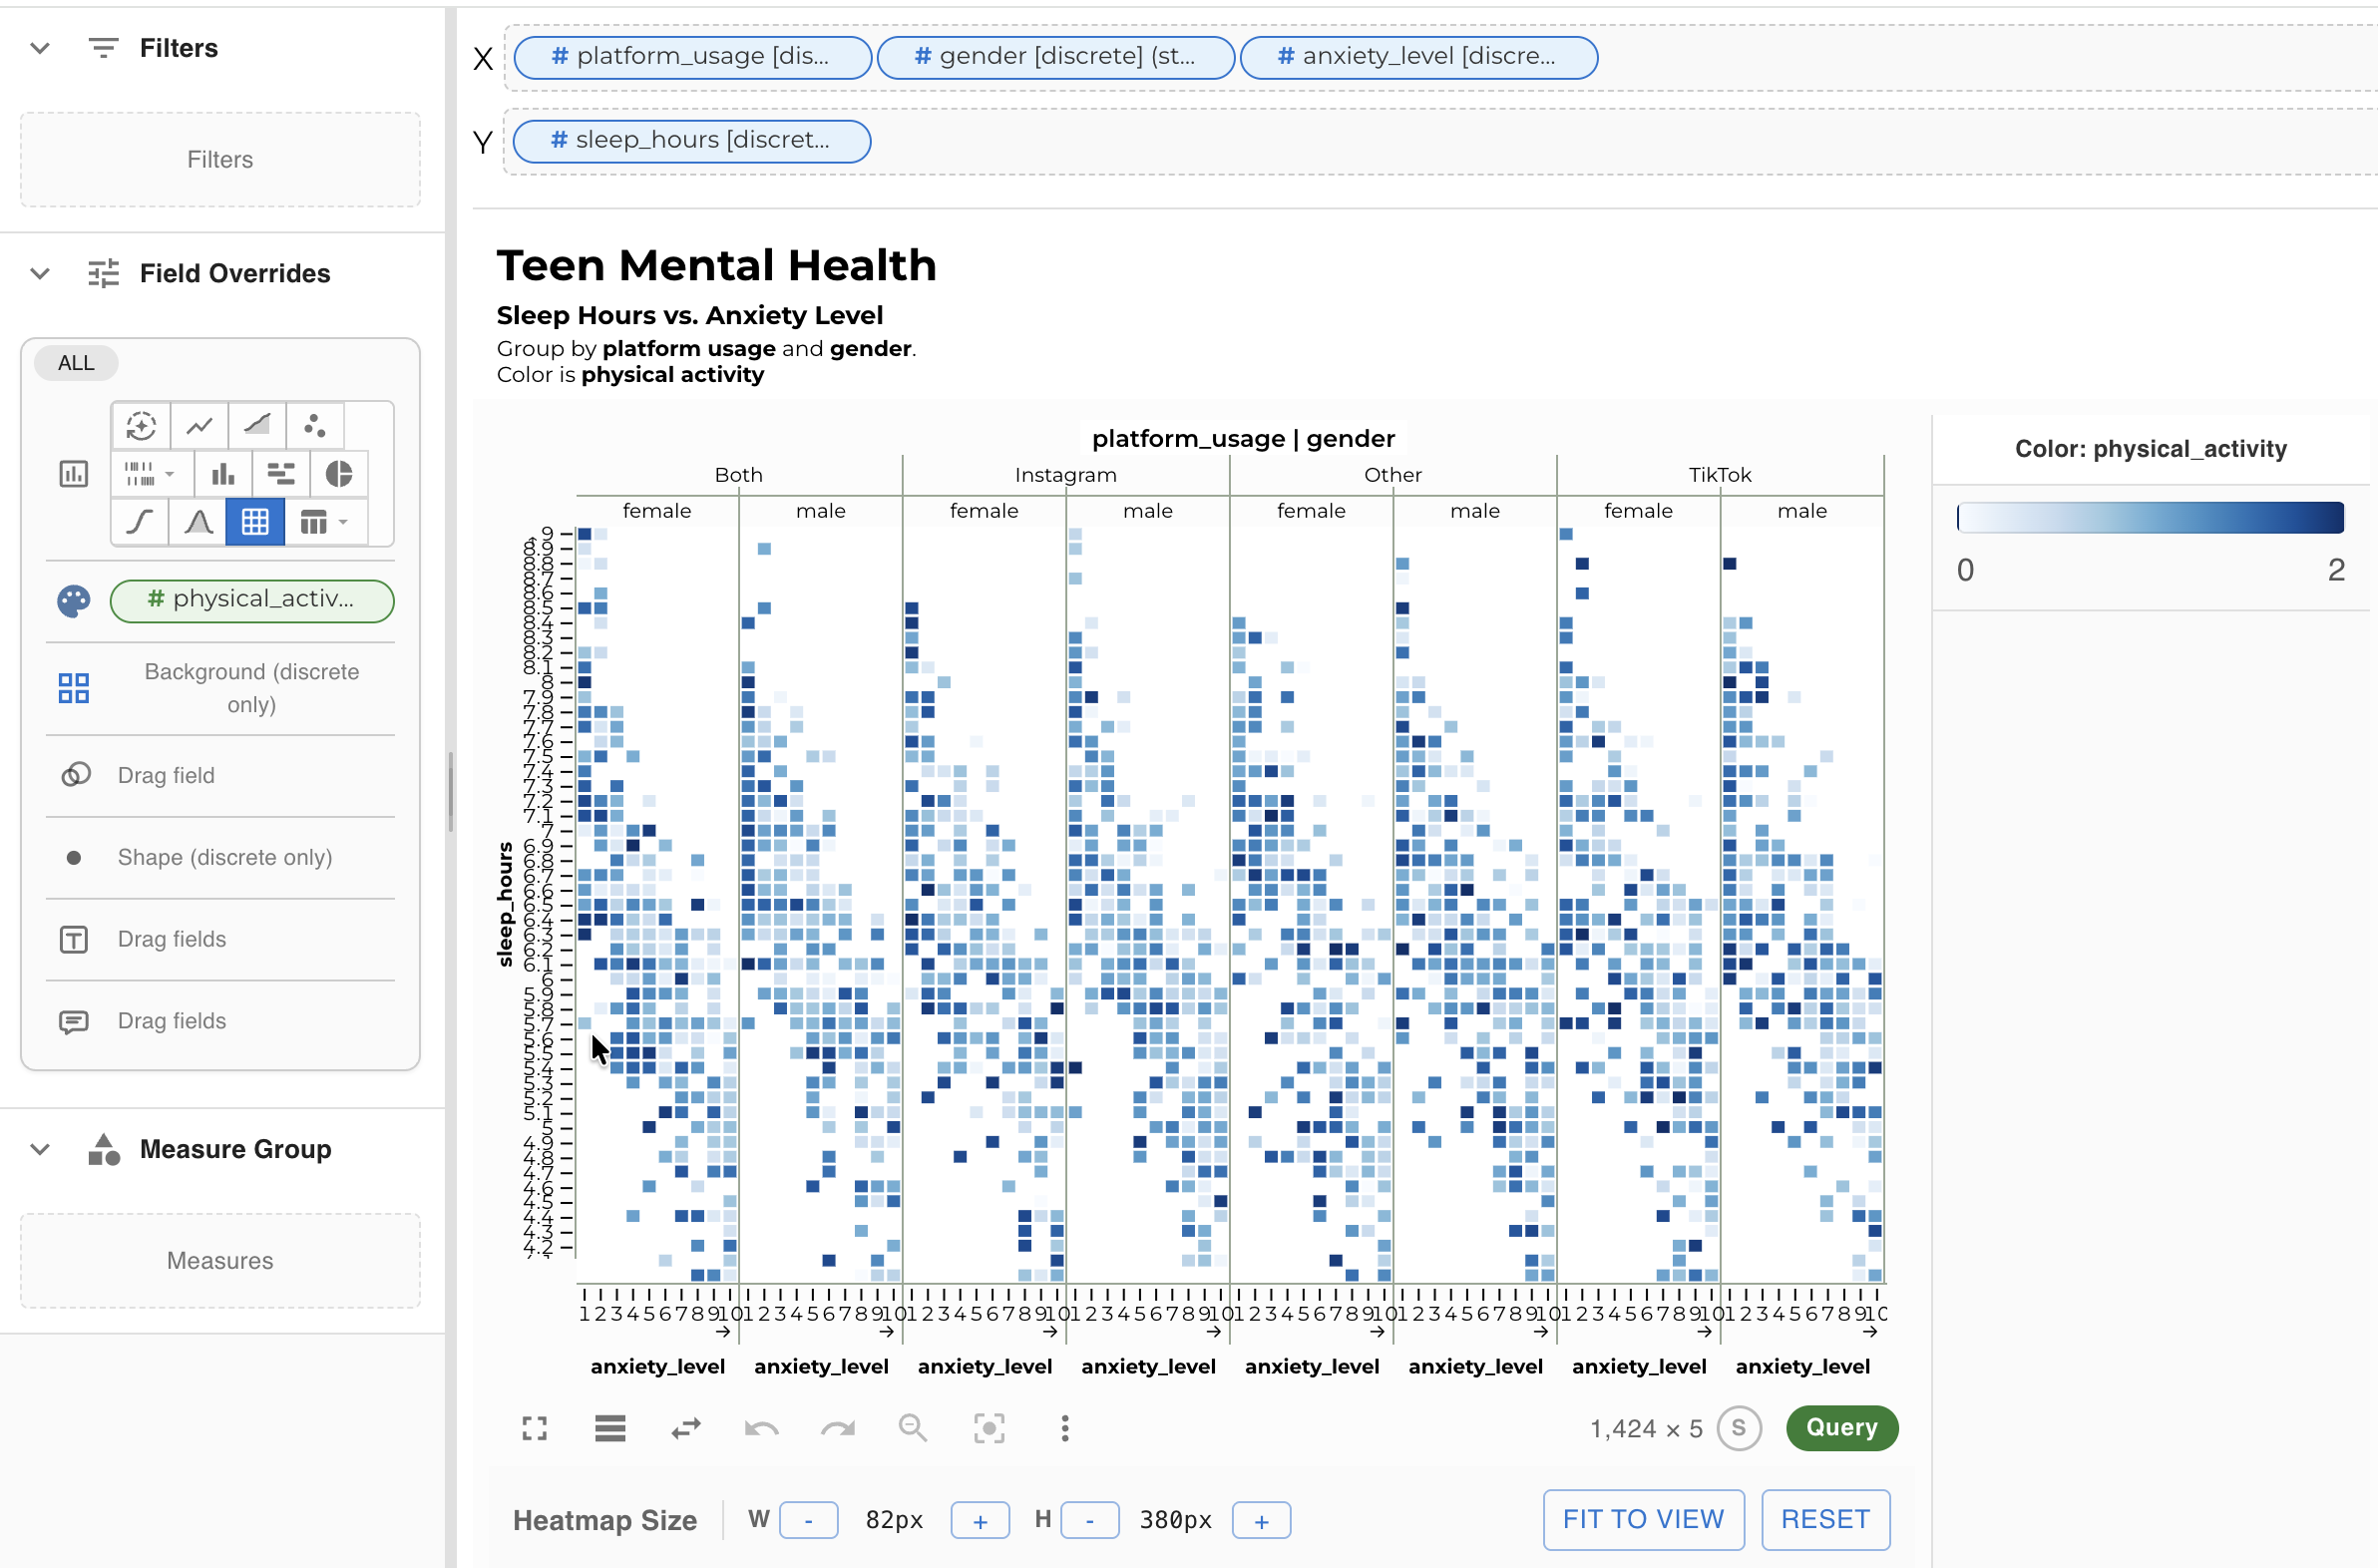
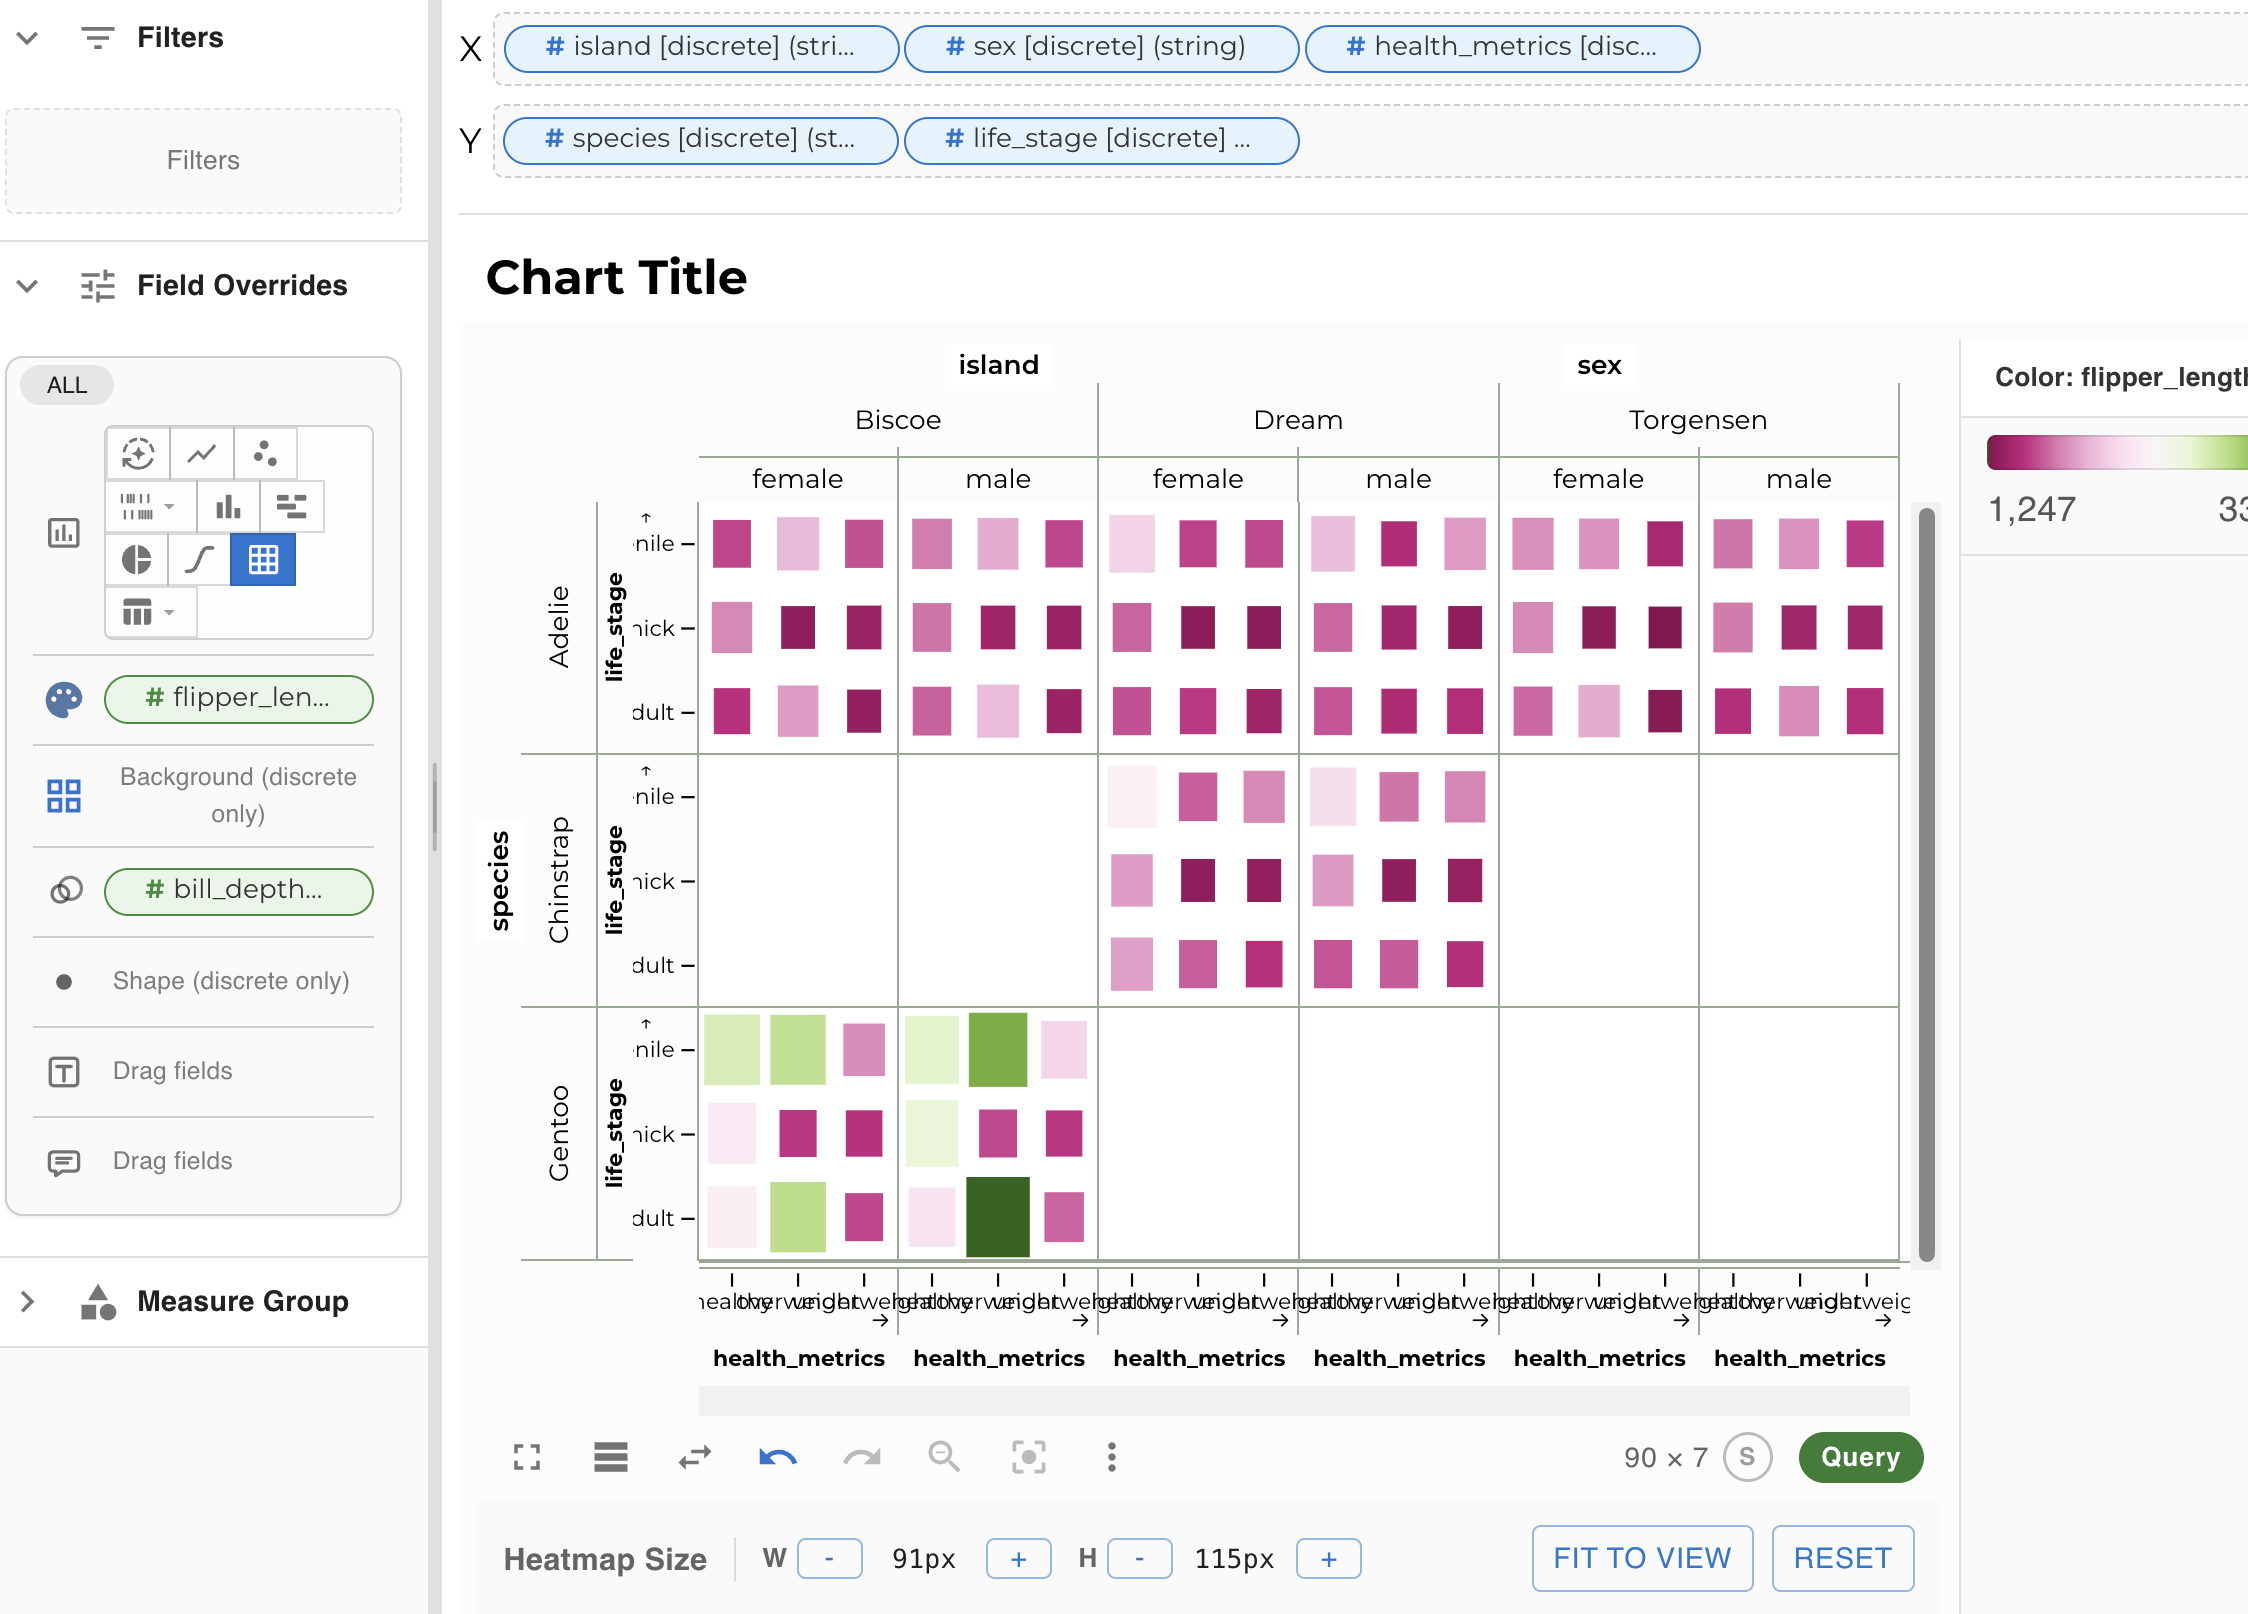
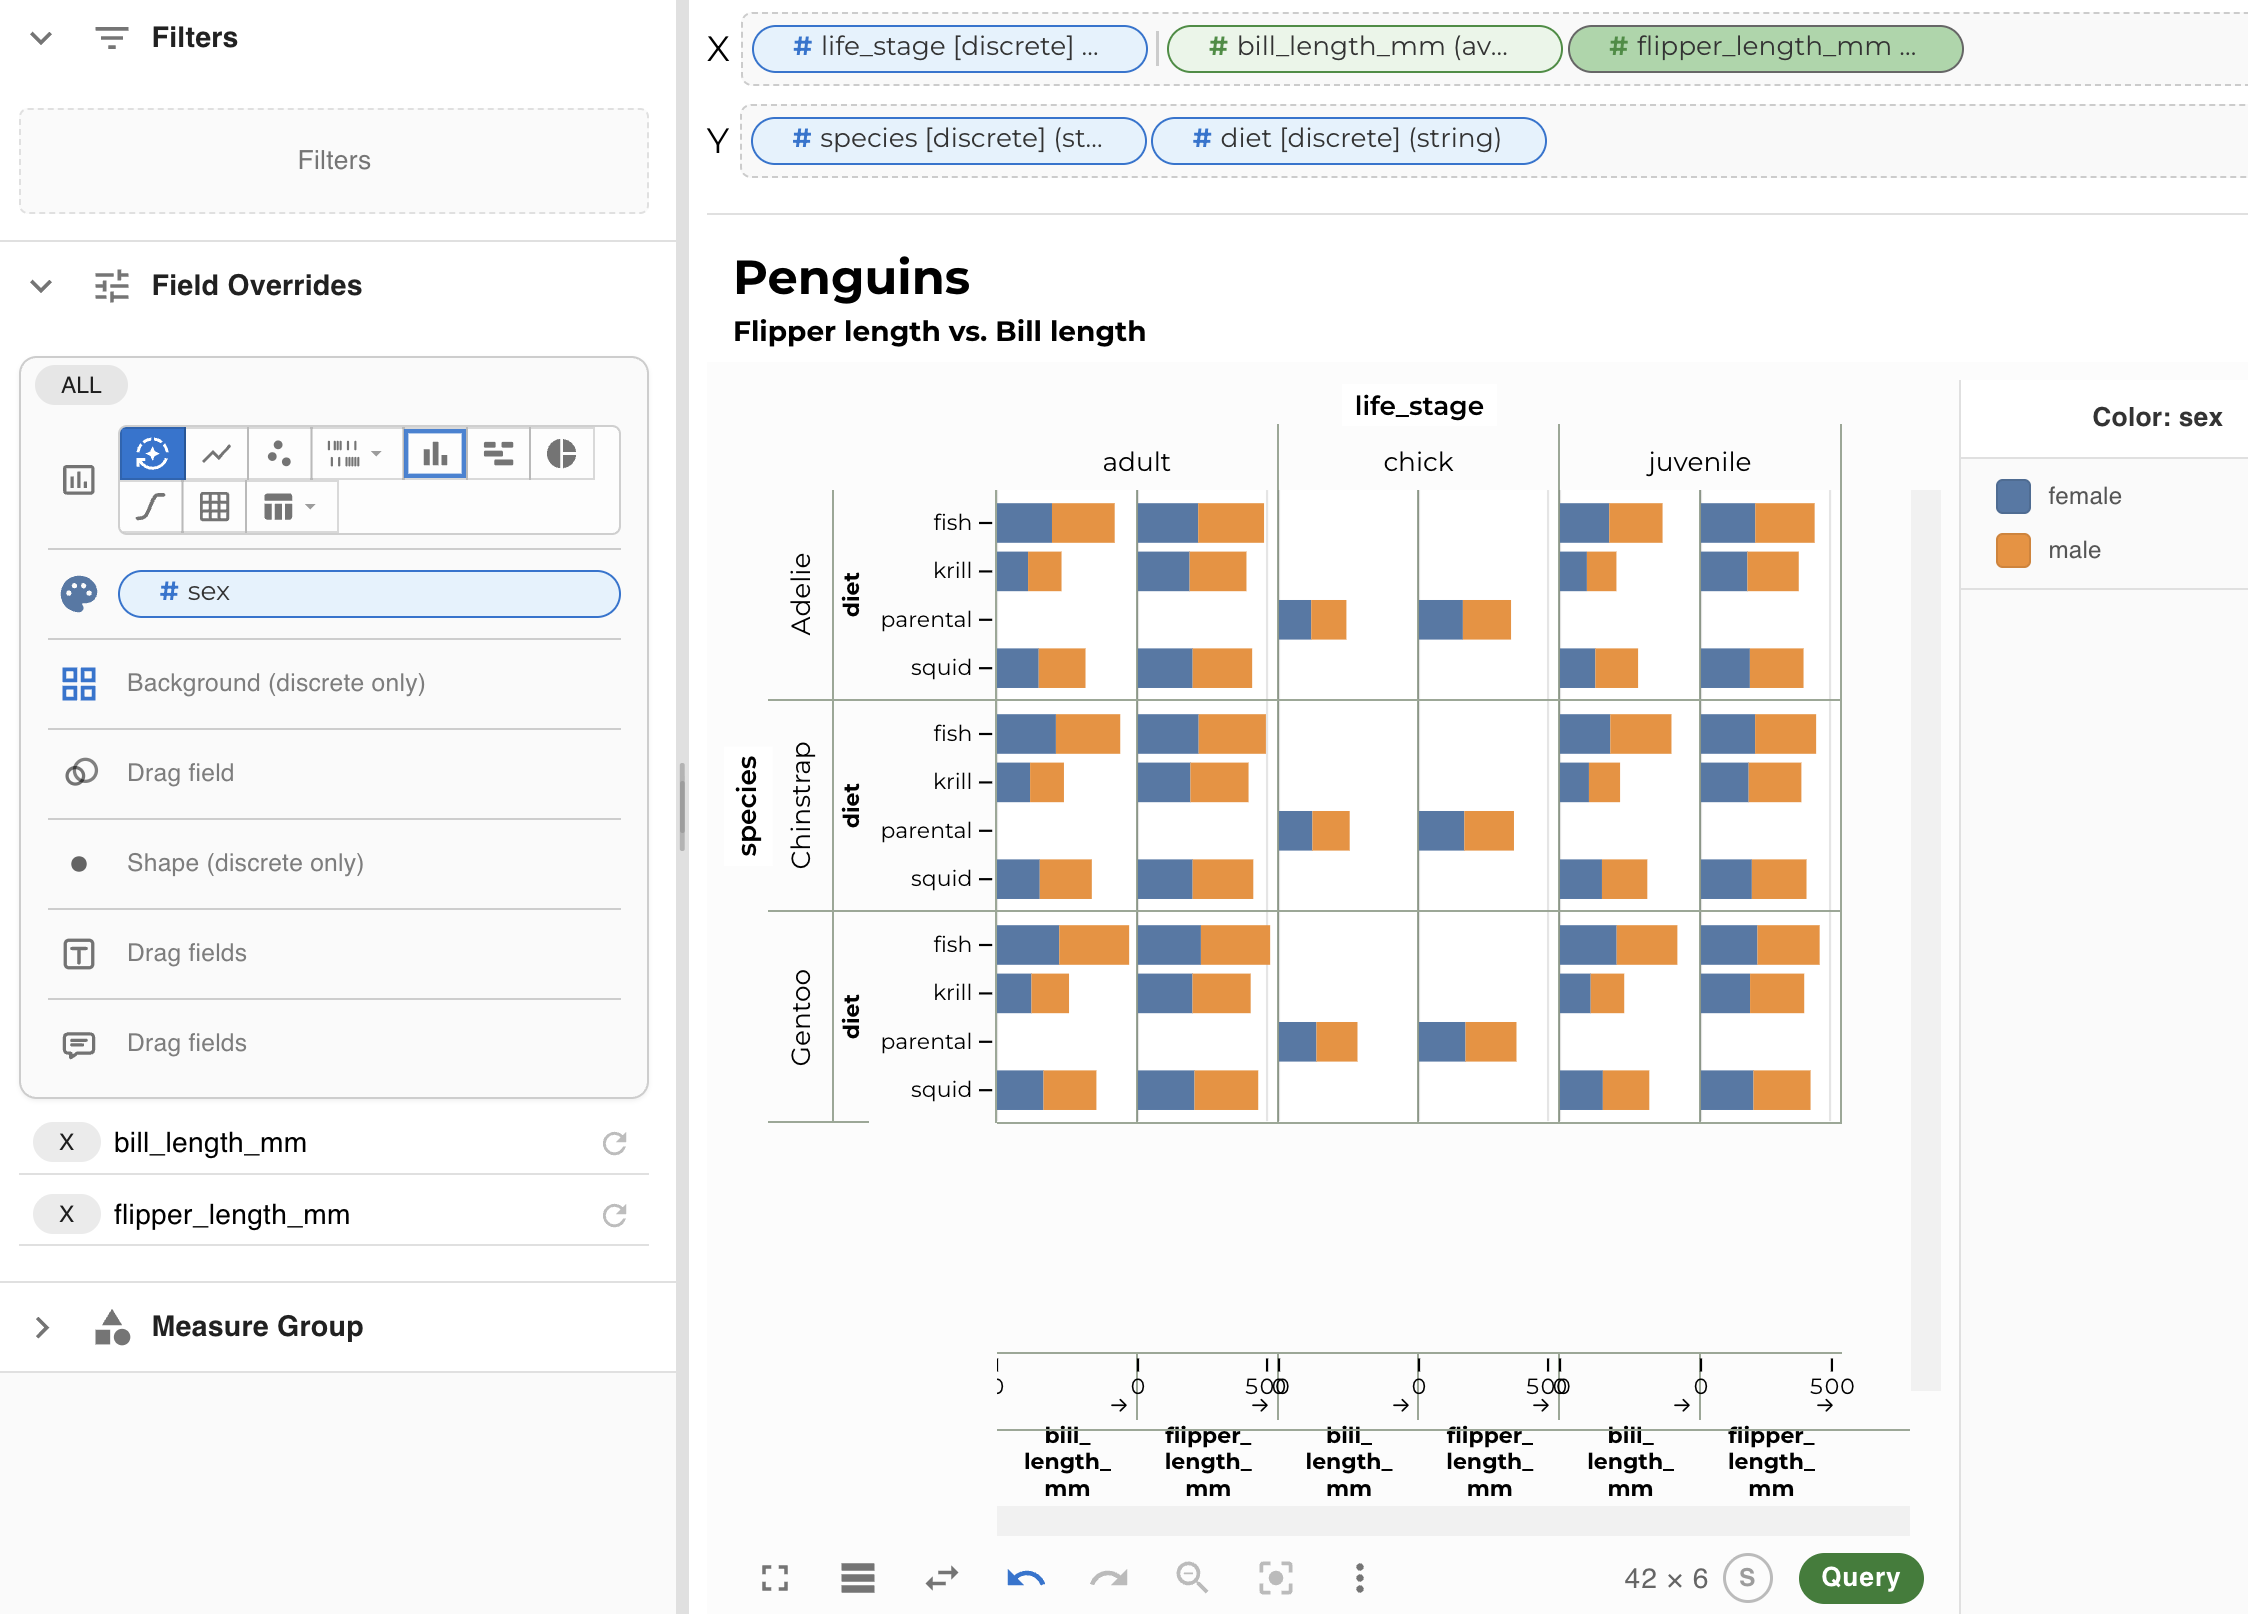
Click image to cycle · ⤢ to enlarge
Heard of Polaris Formalism?
It's the theoretical foundation of data visualization tools like Tableau™.
DataSlicer implements many of Polaris' core concepts.
Works with ClickHouse, Kaggle, CSV, JSON and Parquet files. More connectors planned.
Drag dimensions and measures to build charts and aggregations without writing SQL.
Create charts, distributions, overlays, and small multiples from the same drag-and-drop exploration flow.
Query results are cached locally using DuckDB WASM in your browser, so interactive exploration stays snappy.
Adaptive sampling, smart binning, and layered caching let you explore datasets with billions of rows seamlessly.
AGPL licensed. Self-hostable. No usage tracking, no data leaves your infrastructure.
Point DataSlicer at your ClickHouse instance, or upload a CSV/JSON/Parquet file.
Drag fields onto axes, apply filters, chart type auto-detect or manual.
Results cache locally so subsequent queries are near-instant.
DataSlicer is free to use and open source under the AGPL license.
Self-host it, contribute, or just experiment with the hosted version.